Interpreting the Results
EnTAP provides many output files at each stage of execution to better see how the data is being managed throughout the pipeline:
- Final Annotation Results
- Log File / Statistics
- Expression Filtering
- Frame Selection
- Similarity Searching
- Orthologous Groups/Ontology
- Protein Families (optional)
The two files to check out first are the final annotations and log file. These files are the most important and contain a summary of all the information collected at each stage, including statistical analyses. The remaining files are there for a more in depth look at each stage.
Final Annotations
The final EnTAP annotations are contained within the /outfiles directory. These files are the summation of each stage of the pipeline and contain the combined information. So these can be considered the most important files!
All .tsv files in this section will have the following header information (from left to right)
- Query sequence ID
- Subject sequence ID
- Percentage of identical matches
- Alignment length
- Number of mismatches
- Number of gap openings
- Start of alignment in query
- End of alignment in query
- Start of alignment in subject
- End of alignment in subject
- Expect (e) value
- Query coverage
- Subject title
- Species (DIAMOND)
- Origin Database (DIAMOND)
- ORF (GeneMarkS-T)
- Contaminant (yes/no the hit was flagged as a contaminant)
- Seed ortholog (EggNOG)
- Seed E-Value (EggNOG)
- Seed Score (EggNOG)
- Predicted Gene (EggNOG)
- Taxonomic Scope (EggNOG, tax scope that was matched)
- OGs (EggNOG, orthologous groups assigned)
- Description (EggNOG)
- KEGG Terms (EggNOG)
- Protein Domains (EggNOG)
- GO Biological (Gene Ontology normalized terms)
- GO Cellular (Gene Ontology normalized terms)
- GO Molecular (Gene Ontology normalized terms)
- —– Optional Columns If Using InterProScan —–
- IPScan GO Biological (InterPro)
- IPScan GO Cellular (InterPro)
- IPScan GO Molecular (InterPro)
- Pathways (InterPro)
- InterPro (InterPro, database entry)
- Protein Database (InterPro, database assigned. Ex: pfam)
- Protein Description (InterPro, description of database entry)
- E Value (InterPro, E-value of hit against protein database)
Gene ontology terms are normalized to levels based on the input flag from the user (or the default of 0,3,4). A level of 0 within the filename indicates that ALL GO terms will be printed to the annotation file. Normalization of GO terms to levels is generally done before enrichment analysis and is based upon the hierarchical setup of the Gene Ontology database. More information can be found at GO.
final_annotations_lvlX.tsv
- As mentioned above, the ‘X’ represents the normalized GO terms for the annotation
- This .tsv file will have the headers as mentioned previously as a summary of the entire pipeline
final_annotated.faa / .fnn
- Nucleotide and protein fasta files containing all sequences that either hit databases through similarity searching or through the ontology stage
final_unannotated.aa / .fnn
- Nucleotide and protein fasta files containing all sequences that did not hit either through similarity searching nor through the ontology stage
Log File / Statistics
The log file contains a statistical analysis of each stage of the pipeline that you ran. I’ll give a brief outline of some of the stats performed:
Initial Statistics
- Transcriptome statistics: n50, n90, average gene length, longest/shortest gene
- Summary of user flags
- Summary of execution paths (from config file)
Expression analysis
- Transcriptome statistics: n50, n90, average gene length, longest/shortest gene
- Summary of sequences kept/removed after filtering
Frame Selection
- Transcriptome statistics: n50, n90, average gene length, longest/shortest gene
- Summary of frame selection: Partial, internal, complete genes. Genes where no frame was found
Similarity Searching
- Contaminant/uninformative/informative count
- Phylogenetic/contaminant distribution of alignments
- Alignment distribution based upon frame results (partial/internal/complete)
- Sequence count that did not align against a database reference
- Statistics calculated for each individual database and final results
Gene Family Assignment
- Phylogenetic distribution of gene family assignments
- Gene Ontology level distribution (note: level 0 means all levels)
- Gene Ontology category distribution (biological processes, molecular function, cellular component)
InterProScan
- Additional statistics coming soon!
Final Annotation Statistics
- Statistical summary of each stage
- Runtime
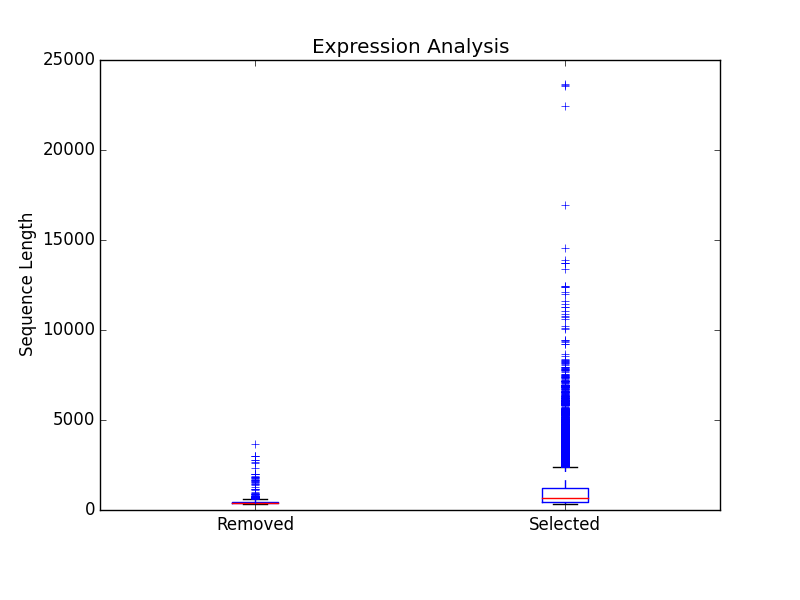
Expression Filtering (RSEM)
The /expression folder will contain all of the relevant information for this stage of the pipeline. This folder will contain the main files (results from expression analysis software), files processed from EnTAP (including graphs).
RSEM Files: /expression
The /expression directory will contain all of the output from RSEM including a converted BAM file (if you input a SAM) and the results of the expression analysis.
EnTAP Files: /processed
This directory will contain all of the files produced from EnTAP concerning expression analysis. With a generic transcriptome input of “Species.fasta”, these files will have the following format
Species_removed.fasta
- Fasta file of sequences that were under the specified FPKM threshold
Species_kept.fasta
- Fasta file of sequences that were kept after filtering (over the FPKM threshold)
/figures
- Directory containing a box plot of sequence length vs the sequences that were removed and kept after expression analysis
Frame Selection (GeneMarkS-T)
The /frame_selection folder will contain all of the relevant information for the frame selection stage of the pipeline. This folder will contain the main files (results from frame selection software), files processed from EnTAP, and figures generated from EnTAP.
GeneMarkS-T Files: /frame_selection
The files within the root /frame_selection directory contain the results from the frame selection portion of the pipeline. More information can be found at GeneMarkS-T. With a generic transcriptome input of “Species.fasta”, these files will have the following format:
Species.fasta.fnn
- Nucleotide fasta formatted frame selected sequences
Species.fasta.faa
- Amino acid fasta formatted frame selected sequences
Species.fasta.lst
- Information on each sequence (partial/internal/complete/ORF length)
.err and .out file
- These files are will contain any error or general information produced from the GeneMarkS-T run
EnTAP Files: /processed
Files within the /processed are generated by EnTAP and will contain ORF information based on the GeneMarkS-T execution.
complete_genes.fasta
- Amino acid sequences of complete genes from transcriptome
partial_genes.fasta
- Amino acid sequences of partial (5’ and 3’) sequences
internal_genes.fasta
- Amino acid sequences of internal sequences
sequences_lost.fasta
- Nucleotide sequences in which a frame was not found. These will not continue to the next stages of the pipeline
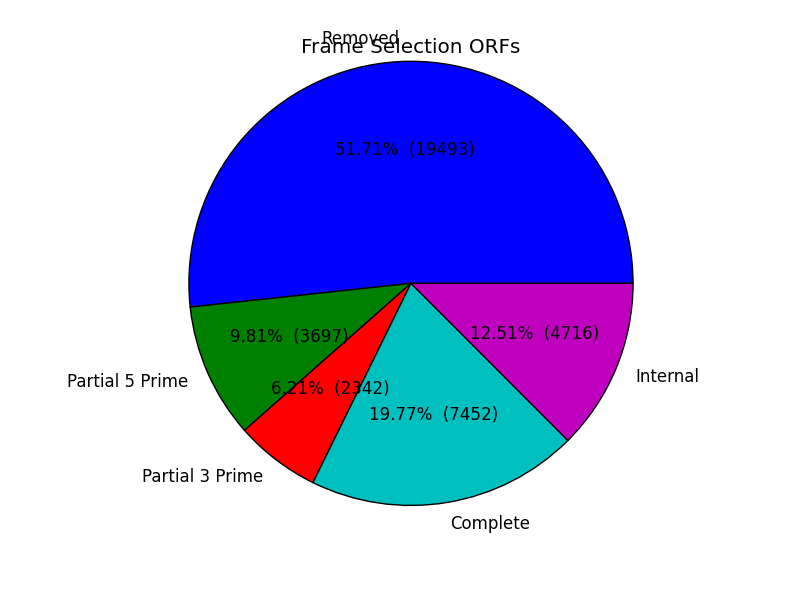
EnTAP Files: /figures
In addition to files, EnTAP will generate figures within the /figures directory. These are some useful visualizations of the information provided by GeneMarkS-T
frame_results_pie.png
- Pie chart representing the transcriptome (post expression filtering) showing complete/internal/partial/and sequences in which a frame was not found
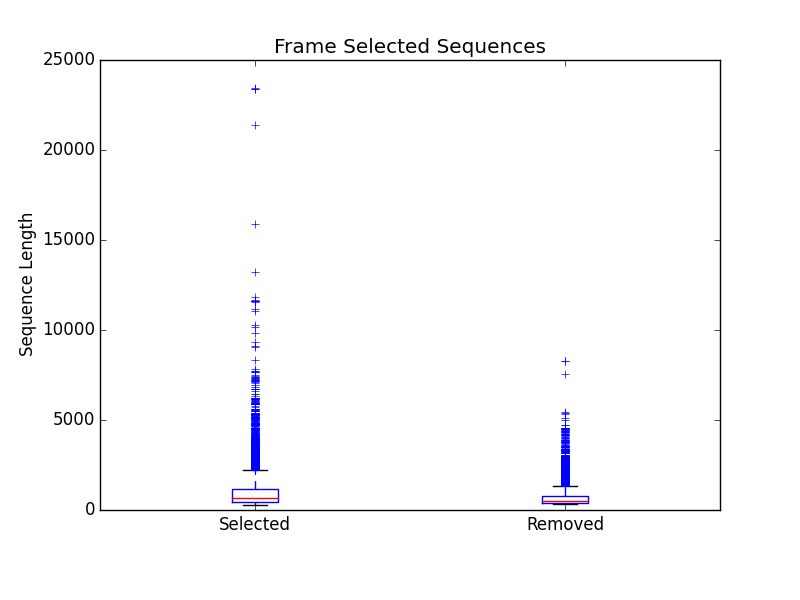
frame_selected_seq.png
- Box plot of sequence length vs. the sequences that were lost during frame selection and the sequences in which a frame was found
Similarity Search (DIAMOND)
The /similarity_search directory will contain all of the relevant information for the similarity searching stage of the pipeline. This folder will contain the main files (results from similarity search software), files analyzing hits from each database, overall results combining the information from each database, and figures generated from EnTAP.
DIAMOND Files: /similarity_search
The files within the /similarity_search directory contain the results from the similarity searching portion of the pipeline against each database you select. More information can be found at DIAMOND. With running _blastp (protein similarity searching), a generic transcriptome input of “Species.fasta”, with a database called “database” the files will have the following format:
blastp_Species_database.out
This contains the similarity search information provided in the format from DIAMOND
Header information (from left to right):
- Query Sequence ID
- Subject Sequence ID
- Percentage of Identical Matches
- Alignment Length
- Number of Mismatches
- Number of gap openings
- Start of alignment in query
- End of alignment in query
- Start of alignment in subject
- End of alignment in subject
- Expect (e) value
- Bit score
- Query Coverage
- Subject Title (pulled from database)
blastp_Species_database_std.err and .out
- These files are will contain any error or general information produced from DIAMOND
EnTAP Files: /processed
Files within the /processed are generated by EnTAP and will contain information based on the hits returned from similarity searching against each database. This information contains the best hits (discussed previously) from each database based on e-value, coverage, informativeness, phylogenetic closeness, and contaminant status.
The files below represent a run with the same parameters as the section above:
All the TSV files mentioned in this section will have the same header as follows (from left to right):
- Query sequence ID
- Subject sequence ID
- Percentage of identical matches
- Alignment length
- Number of mismatches
- Number of gap openings
- Start of alignment in query
- End of alignment in query
- Start of alignment in subject
- End of alignment in subject
- Expect (e) value
- Query coverage
- Subject title
- Species (pulled from hit)
- Origin Database
- ORF (taken from frame selection stage)
- Contaminant (yes/no the hit was flagged as a contaminant)
database/best_hits.faa and .fnn and .tsv
- Best hits (protein and nucleotide) that were selected from this database
- This contains ALL best hits, including any contaminants that were found as well as uninformative hits
- The .tsv file contains the header information mentioned above of these same sequences
- Note: Protein or nucleotide information may not be available to report depending on your type of run (these files will be empty)
database/best_hits_contam.faa/.fnn/.tsv
- Contaminants (protein/nucleotide) separated from the best hits file. As such, these contaminants will also be in the _best_hits.faa/.fnn.tsv files
database/best_hits_no_contam.faa/.fnn/.tsv
- Sequences (protein/nucleotide) that were selected as best hits and not flagged as contaminants
- With this in mind: best_hits = best_hits_no_contam + best_hits_contam
- These sequences are separated from the rest for convenience if you would like to examine them differently
database/no_hits.faa/.fnn/.tsv
- Sequences (protein/nucleotide) from the transcriptome that did not hit against this particular database.
- This does not include sequences that were lost during expression filtering or frame selection
database/unselected.tsv
- Similarity searching can result in several hits for each query sequence. With only one best hit being selected, the rest are unselected and end up here
- Unselected hits can be due to a low e-value, coverage, or other properties EnTAP takes into account when selecting hits
EnTAP Files: /overall_results
While the /processed directory contains the best hit information from each database, the /overall_results directory contains the overall best hits combining the hits from each database.
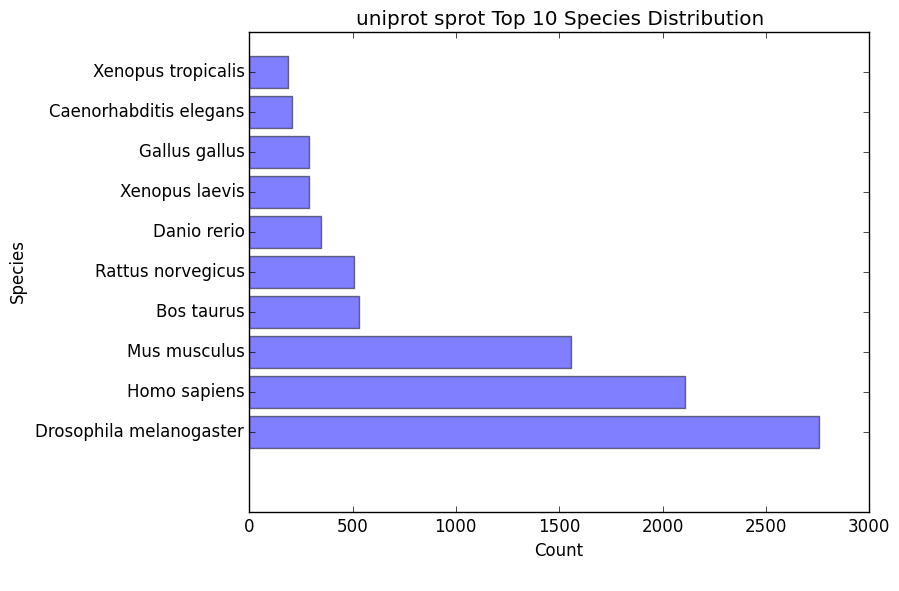
EnTAP Files: /figures
In addition to files, EnTAP will generate figures within the /figures directory for each database. These are some useful visualizations of the information provided by similarity searching.
Here, there will be several figures:
species_bar.png / species_bar.txt
- Bar graph representing the top 10 species that were hit within a database
- Text file representing the data being displayed
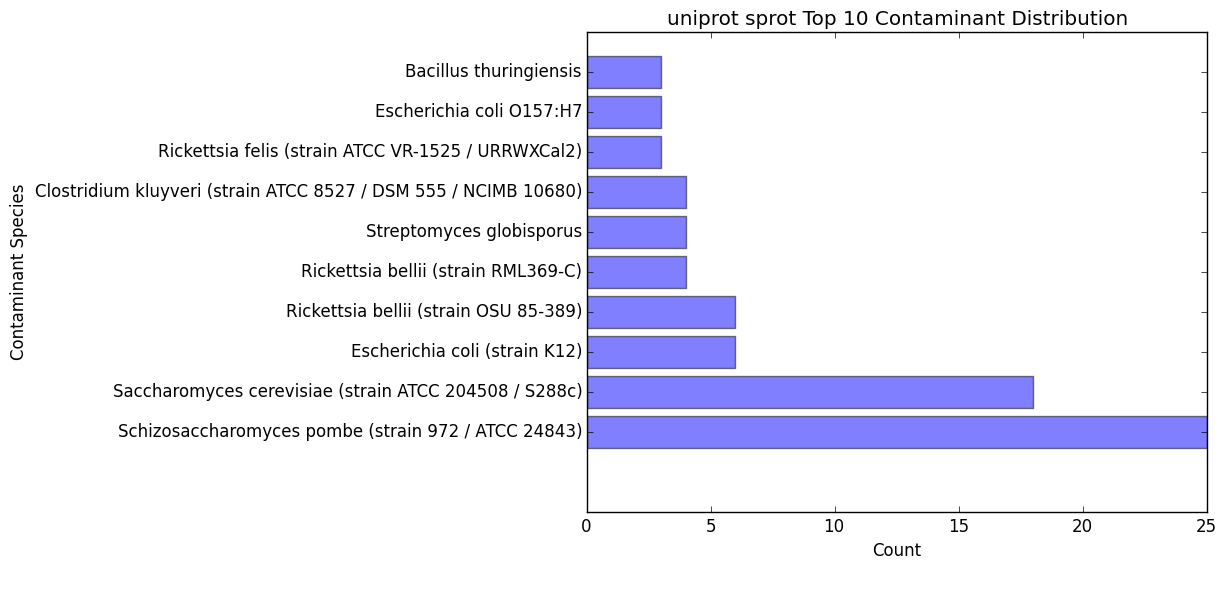
contam_bar.png / contam_bar.txt
- Bar graph representing the top 10 contaminants (within best hits) that were hit against the databast
- Text file representing the data being displayed
Orthologous Groups/Ontology (EggNOG)
The /ontology/EggNOG directory will contain all of the relevant information for the EggNOG stage of the pipeline. This folder will contain the EggNOG files, files analyzing the annotation from EggNOG, and figures generated from EnTAP.
EggNOG Files: /ontology/EggNOG
Files within the /ontology/EggNOG are generated by EggNOG and will contain information based on the hits returned from EggNOG against the orthologous databases. More information can be found at EggNOG.
annotation_results.emapper.annotations
- EggNOG results for sequences that previously hit against DIAMOND databases in similarity searching
annotation_results_no_hits.emapper.annotations
- EggNOG results for sequences that previously did NOT hit against DIAMOND databases in similarity searching
EnTAP Files: /processed
Files within the /processed are generated by EnTAP and contain information on what sequences were annotation and which were not.
unannotated_sequences.fnn/faa
- Sequences where no gene family could be assigned (nucleotide/protein)
annotated_sequences.fnn/faa
- Sequences where a gene family could be assigned (nucleotide/protein)
EnTAP Files: /figures
The /figures will contain figures generated by EnTAP of Gene Ontology and Taxonomic distribution of the results
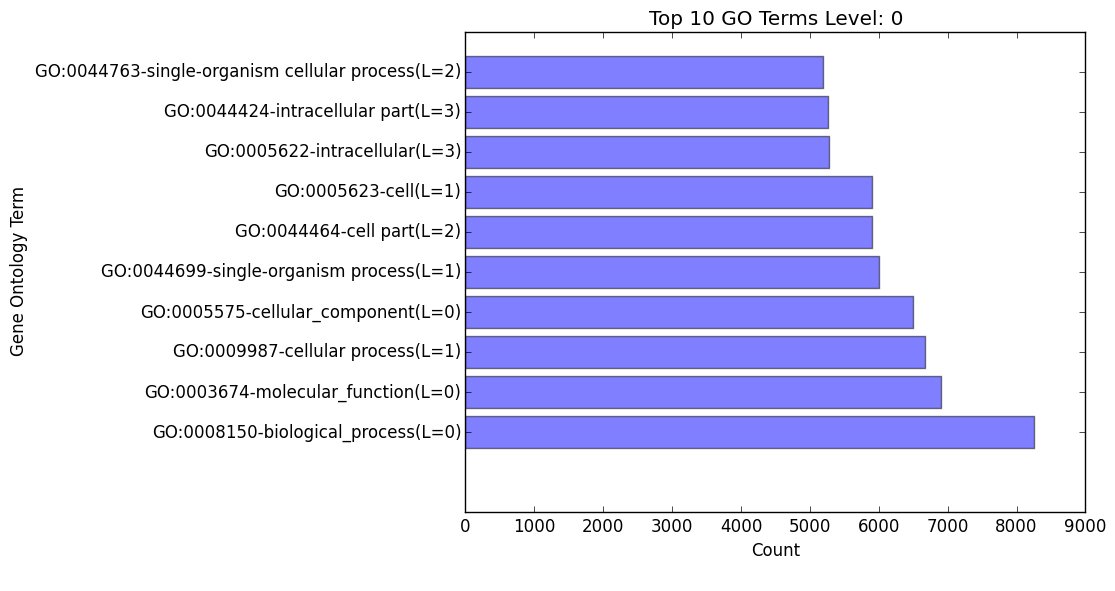
(overall/molecular_function/cellular_component/biological_process)#_go_bar_graph.png/.txt
- Bar graph of each category of Gene Ontology terms of a specific level # (remember, level 0 signifies all levels!)
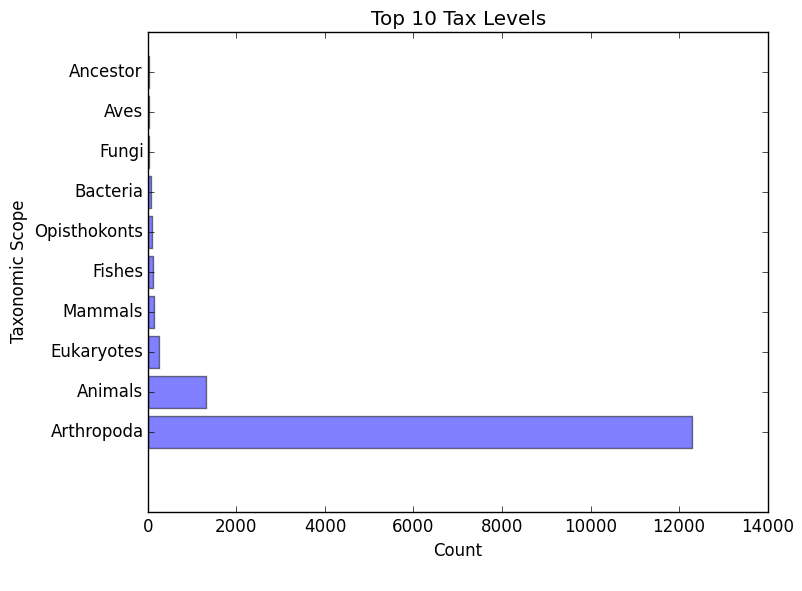
eggnog_tax_scope.png/.txt
- A bar graph representation of the taxonomic scope of the gene families assigned through EggNOG
Protein Families (InterProScan)
Full documentation coming soon!